
RETECHNOLOGY PREMIUM MARKETPLACE RELATED PRODUCTS | WEBINARS | SPECIAL OFFERS


You are viewing our site as an Agent, Switch Your View:
Agent | Broker Reset Filters to Default Back to ListDrilling Down on Neighborhood Data in RPR
January 25 2016
The popularity and precision of lifestyle-oriented home buying searches is growing rapidly. What used to be a basic search for the number of beds and baths, and possibly schools, has transformed into an all-out attempt to find the perfect home, near desired amenities, within commutable distances, and among demographic groups who might share similar lifestyle preferences.
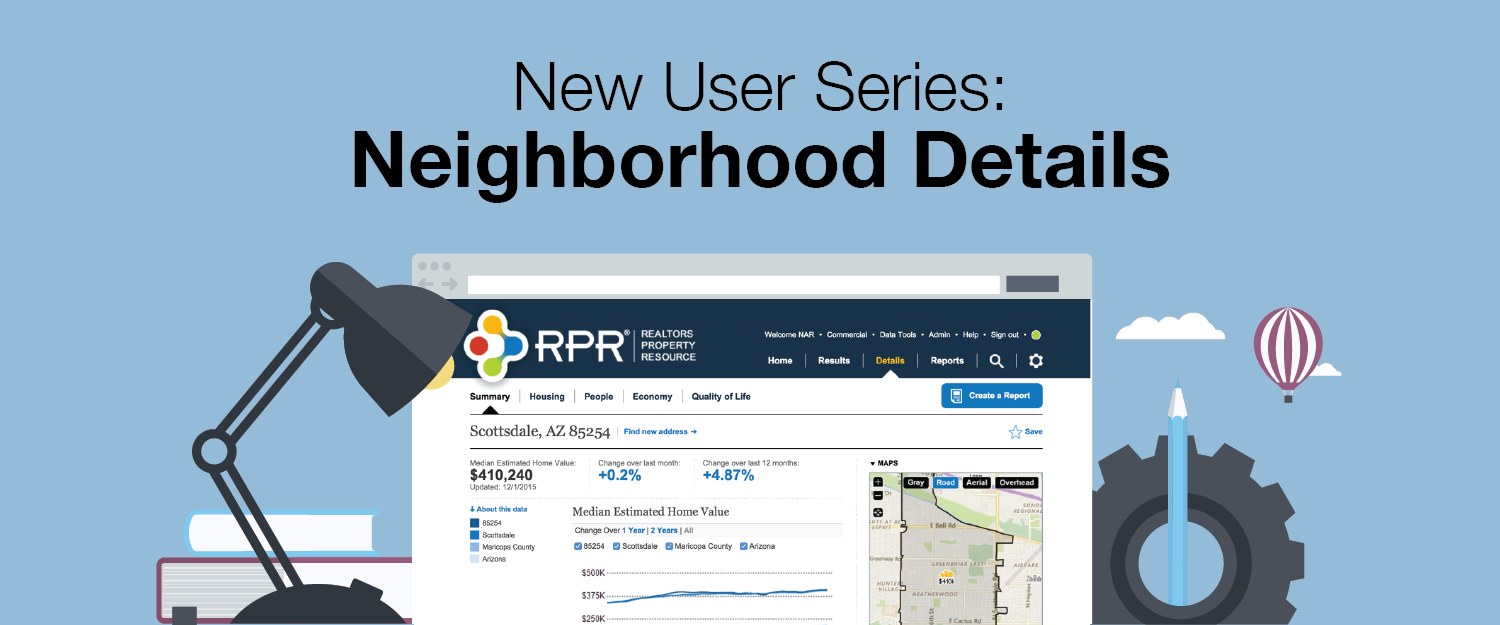
Welcome to RPR Neighborhoods, part our series of articles for new and seasoned RPR users.
Here we will offer basic tips and tools on how to help your clients successfully integrate lifestyle preferences into a home search. Then, we'll show you how to master the art of creating marketing materials that will build your brand and create a wow factor for your clients using the RPR Neighborhood Report.
Let's begin by dissecting the Neighborhoods page found at narrpr.com.
A simple search yields sophisticated results
From the RPR homepage, select Neighborhoods from the six options presented atop the search bar. Enter a city and state, or in some cases, a neighborhood, and press enter to display five easily navigated pages of neighborhood data. Note that there are a variety of avenues for accessing this data throughout the RPR platform, such as when you are into a property search, but, for now, we'll focus on this big picture overview.
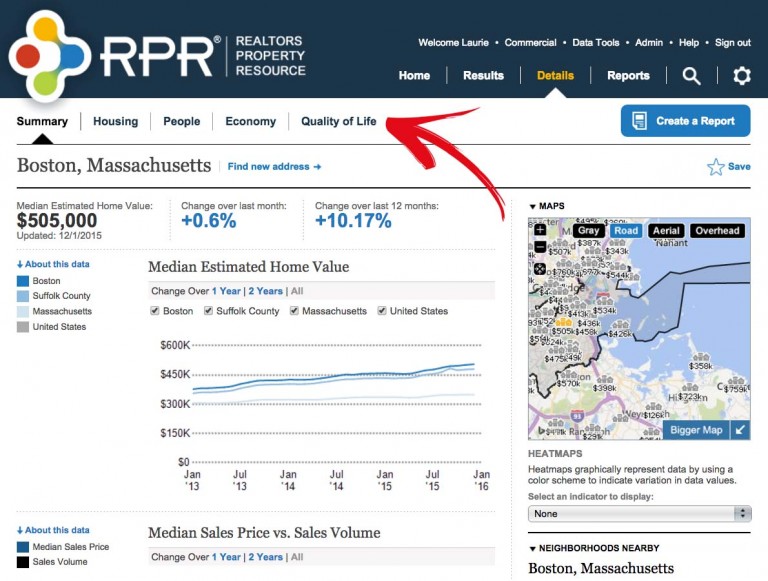
Summary
Here you'll find an overview of Median Sales Price vs. Sales Volume, Median Listing Price vs. Listing Volume, Population of Children by Age Group, and Population of Adults by Age Group for the area searched.
Housing
This page highlights your neighborhood's housing characteristics compared to the county, state and nation. You'll also find easy-to-read graphs on the price, size, age and number of bedrooms on homes sold in the area. The side-by-side chart also includes comparisons for home ownership, rent, and information about permits and buildings.
People
A favorite among home buyers, the People page gets to the heart of who lives in the neighborhood and whether those demographics are a good fit for your client. Again, RPR features a side-by-side comparison chart, but this time the data measures population counts, densities and changes; median age, gender, and education levels. You'll also find breakdowns of population of children and adults by age group, the number of households with children (particularly important for younger families and/or rising retirees who want a quiet place to live), income brackets, occupations, and even voting patterns.
Economy
Look to the Economy page for a clear picture of per capita and median household incomes, as well as employment figures.
Quality of Life
For clients who are unfamiliar with the area, this page is particularly helpful in conveying weather, commute times, transportation options, and water quality. It even includes the number of Superfund and Brownfield sites. Again, all in a side-by-side, neighborhood/county/state/country comparison.
Show them, don't tell them: RPR's Neighborhood Report
Here's where you bring in all together, in one customized, branded report, with fields you choose to include, in addition to your logo, contact info, photo and more.
Create Your Neighborhood Report
- Select Reports from the homepage or from within the results of your search.
- Select Neighborhood Report.
- Choose the specific elements to include or omit in the report by opening the More Detail link below the name of the report type on the generation page.
- Choose the specific elements to include or omit on the report cover. These options are displayed in the right-hand sidebar, below the image of the report cover. Display your contact information, photo, logo and more. Show or hide page numbers.
- Personalize your report with a message.
- Choose a delivery method. Display the report as a PDF or email it to yourself or a client (or both). From the RPR app even text the report to your recipient.
- Press Get Report.
Next Steps
You've completed your introduction to RPR's Neighborhood page. Now it's time to jump in and get to know the site on your own. Here are a few options to get started:
- Go directly to the Neighborhoods page at narrpr.com.
- Call RPR's 24/7 Customer Support team at 877.977.7576.
To view the original article, visit the RPR blog.